The largest coal mine expansion in NSW since the Paris Agreement looks set to be considered this year, with eight new projects on the government's books.
A Lock the Gate analysis shows that if all these projects are built, they will collectively be responsible for more than 1.5 billion tonnes of greenhouse gas emissions after the coal from the mines is burnt - more than 10 times NSW’s emissions total in 2019.
The largest is Glencore and Yancoal’s Hunter Valley Operations project, which alone would be responsible for a whopping 1.2 billion tonnes of CO2-e. Public submissions concerning the project closed Monday February 27.
The total emissions figure from all the projects is also likely to be much higher, with some coal companies yet to submit their GHG estimates, and serious questions around the accuracy of how fugitive emissions are measured in Australia.
Lock the Gate Alliance NSW Coordinator Nic Clyde said the NSW Perrottet Government’s policy of letting the coal mining sector charge full steam ahead without constraint fatally undermined its stated climate goals.
“Dangerous climate change caused by the burning of fossil fuels like coal has led to devastating extreme weather events all over NSW,” he said.
“Anthony Roberts should have amended planning laws to put a safe climate before coal and gas mining, but he has failed to do so.
“Due to his failure to act, NSW is now staring down the barrel of the biggest climate bomb from coal mine expansions since the Paris Agreement - putting our future at risk.
“When every other sector in the NSW economy is doing their bit to start reducing emissions to address climate change, the coal and gas sector is running in the opposite direction.
“The Hunter Valley Operations coal expansion being assessed by the NSW Government right now is actually proposing to double its direct greenhouse emissions.
“As climate heats up as an election issue, the failure of the NSW Government to act on this most crucial element of reining in coal and gas for a safe future is on stark display.”
Since the Paris Agreement entered into force in November 2016, the NSW Government has approved 26 new coal and gas projects (see table here), responsible for a combined greenhouse gas emissions total of about 4.4 billion tonnes of CO2e.
ENDS
Background:
Lock the Gate Alliance has analysed the scale of new coal capacity approved in NSW each year since the Paris Agreement. The results are presented in the graph below and are derived from publicly available government and company documents (further details available on request).
Figure 1: New coal production approved in NSW since the Paris Agreement entered into force in November 2016 (blue) vs new coal capacity under assessment (red).
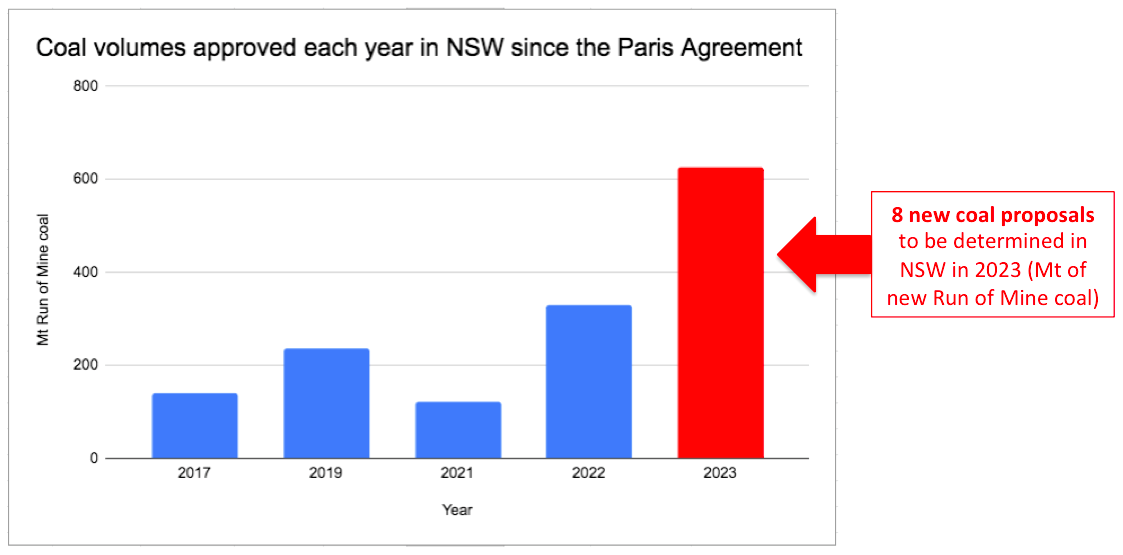
Table 1: Coal projects expected to be assessed this year and their emissions:
|
Project |
Status |
Total Scope 1 GHG Mt CO2~e |
Total Scope 2 GHG Mt CO2~e |
Total Scope 3 GHG Mt CO2~e |
Total GHGs (lifetime) Mt CO2~e |
Seeking approval until |
Additional ROM coal approved (Mt) |
References |
|
Response to submissions |
0.58 |
0.21 |
64.57 |
65.36 |
2037 |
25.9 |
ROM coal: Newstan Mine Extension Project EIS Main Report, pg i. GHG info: Table 48, pg 79, Appendix O Air quality and GHG |
|
|
EIS expected Q1 2023 |
Data not yet available (will be released in EIS) |
8.5 |
||||||
|
EIS expected Q1 2023 |
Data not yet available (will be released in EIS) |
4 yrs (2026 - 2030) |
88 |
ROM coal # is an estimate as the EIS for this Project has not been released. 88Mt ROM is based on current production continuing for another 4 years. |
||||
|
EIS exhib ends 27/02/23 |
33.28 |
1.88 |
1,166.86 |
1202.02 |
25 yrs (2025 - 2050) |
400 |
Appendix H - Air quality and GHG, Jacobs, pg 87 (Table 30) |
|
|
Response to submissions |
0.79 |
0.32 |
61.73 |
62.84 |
3 yrs (2033 - 2036) |
28.1 |
GHG reference here, pg 62 |
|
|
Response to submissions |
1.97 |
0.22 |
23.49 |
25.35 |
2 yrs (2027-2029) |
9.5 |
||
|
Response to submissions |
0.13 |
0.25 |
64.59 |
64.97 |
2 yrs (2033-2035) |
27.5 |
GHG reference here, pg 103 here |
|
|
Response to submissions |
0.60 |
0.20 |
85.80 |
86.59 |
10 yrs (2025-2034) |
40 |
GHG reference pg 17 here |
|
|
TOTALS |
37.35 |
2.90 |
1467.04 |
1507.13 |
627.5 |
|||